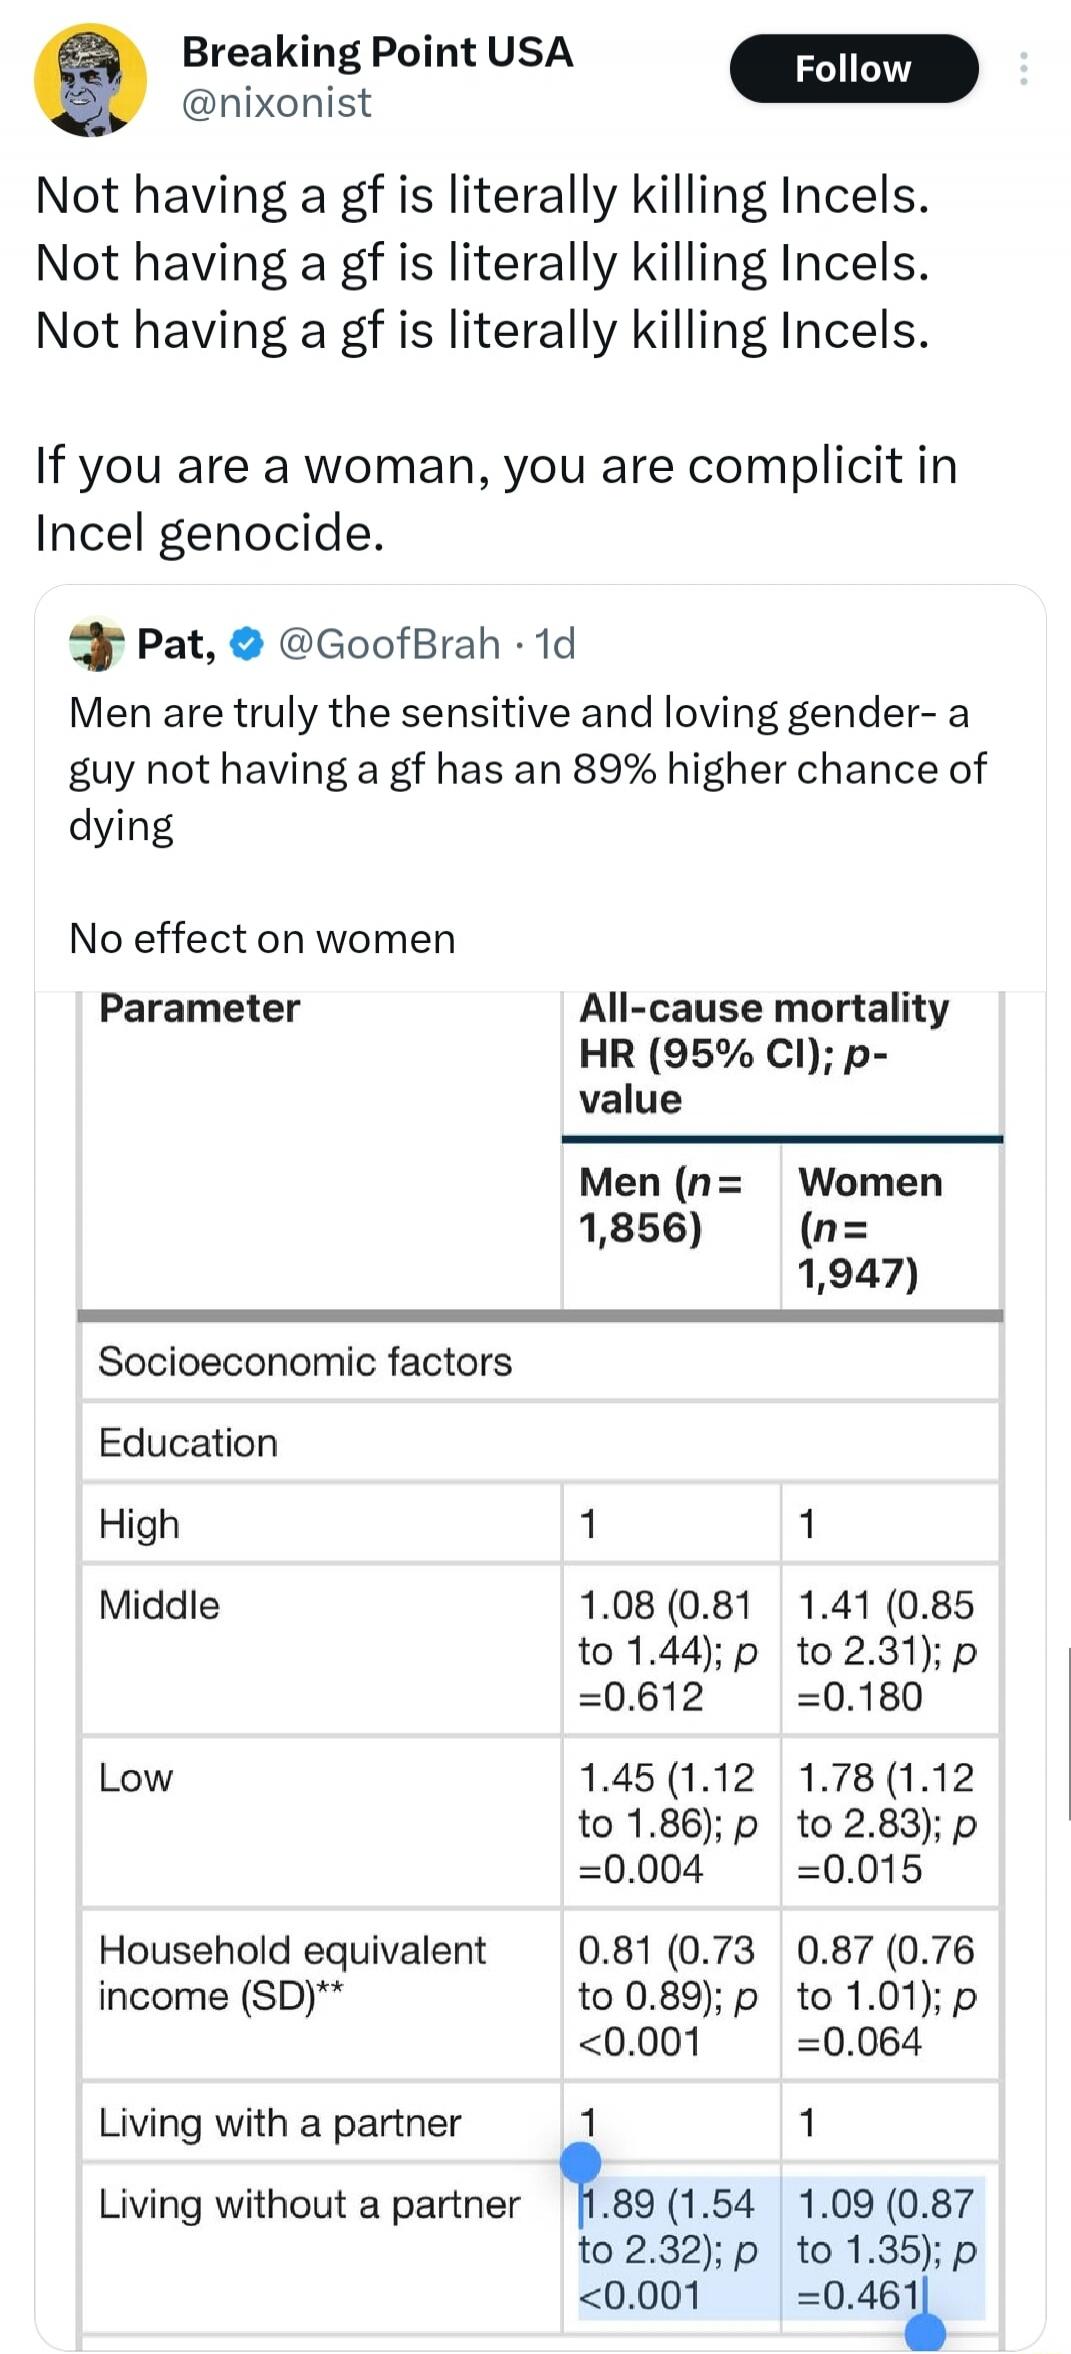
Breaking Point USA @nixonist Not having a gf is literally killing Incels. Not having a gf is literally killing Incels. Not having a gf is literally killing Incels. If you are a woman, you are complicit in Incel genocide. Pat, @GoofBrah 1d Men are truly the sensitive and loving gender- a guy not having a gf has an 89% higher chance of dying. No effe
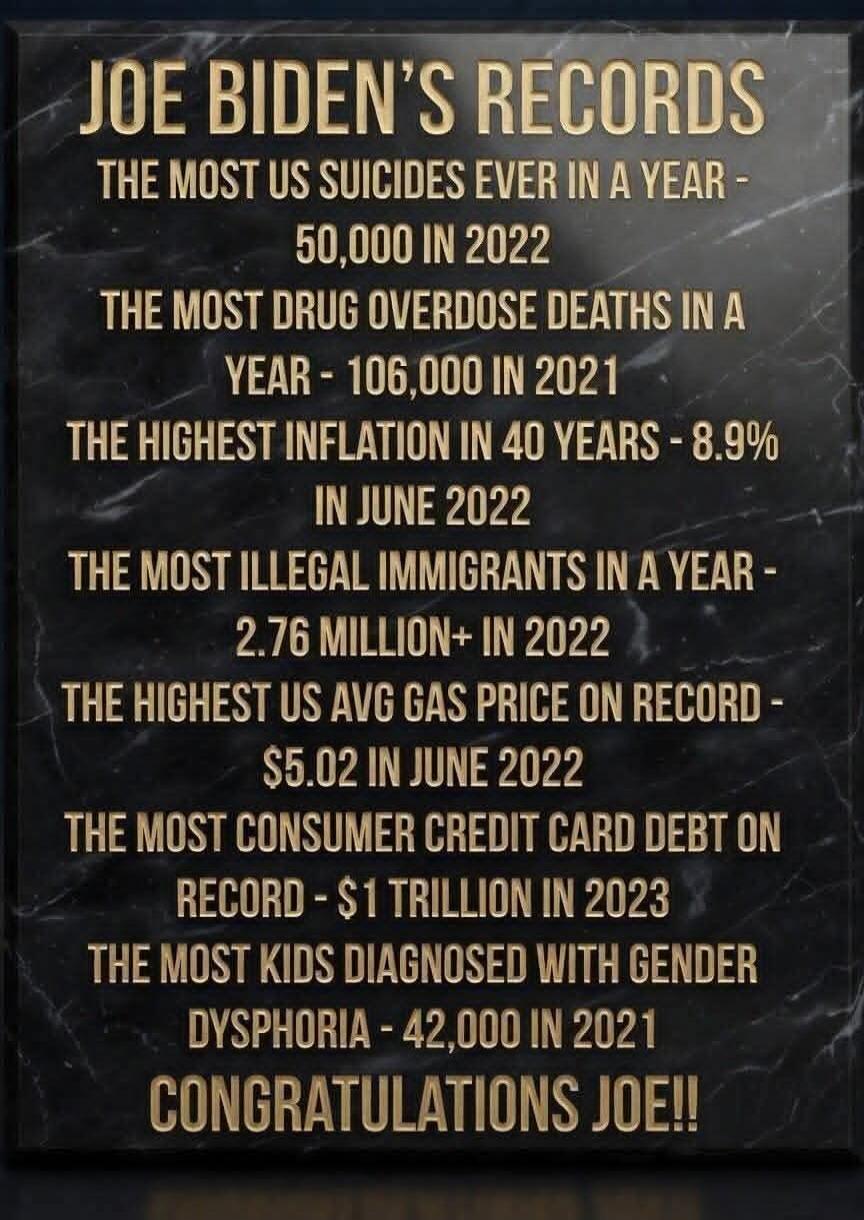
JOE BIDEN'S RECORDS THE MOST US SUICIDES EVER IN A YEAR - 50,000 IN 2022 THE MOST DRUG OVERDOSE DEATHS IN A YEAR - 106,000 IN 2021 THE HIGHEST INFLATION IN 40 YEARS - 8.9% IN JUNE 2022 THE MOST ILLEGAL IMMIGRANTS IN A YEAR - 2.76 MILLION+ IN 2022 THE HIGHEST US AVG GAS PRICE ON RECORD - $5.02 IN JUNE 2022 THE MOST CONSUMER CREDIT CARD DEBT ON RECOR
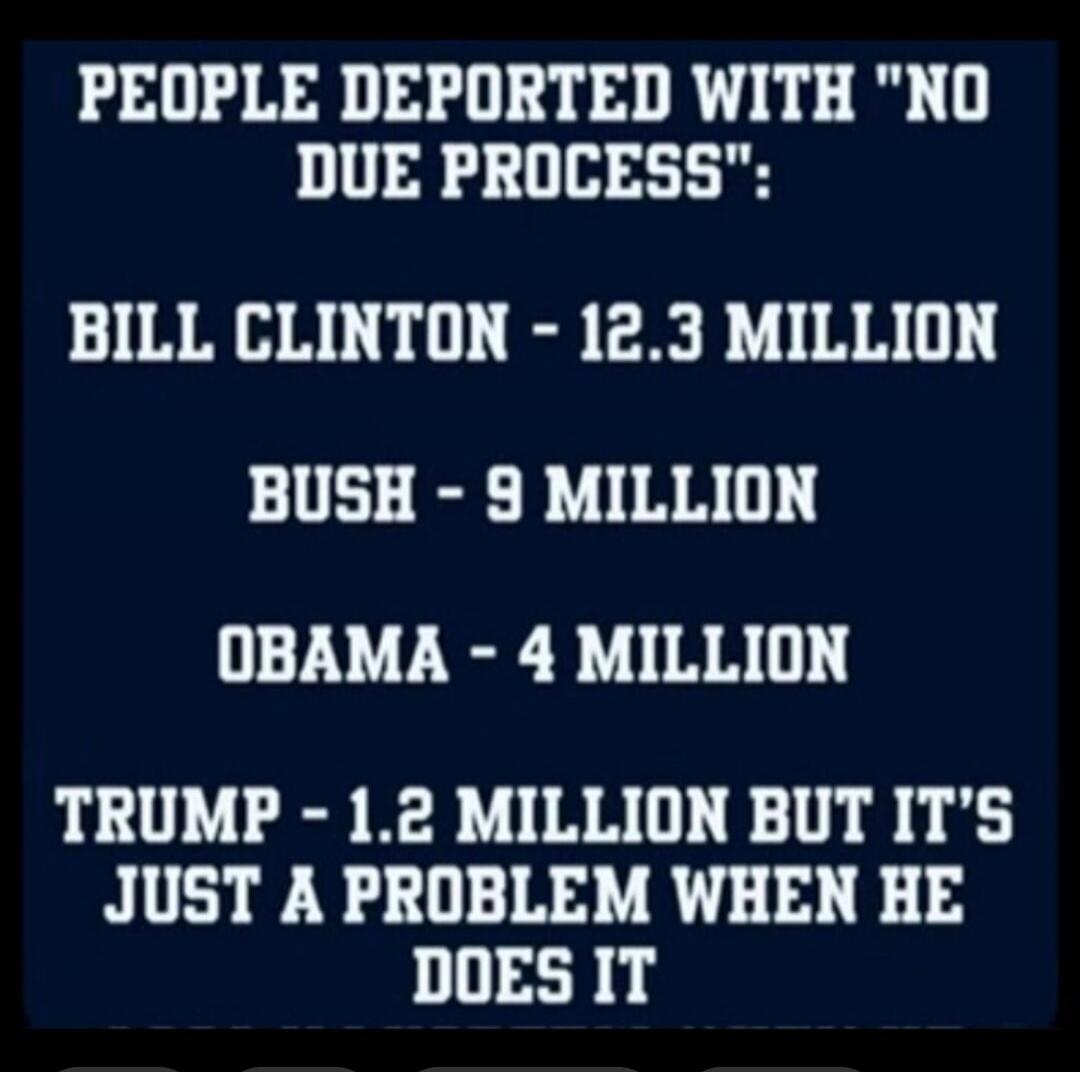
PEOPLE DEPORTED WITH "NO DUE PROCESS": BILL CLINTON - 12.3 MILLION BUSH - 9 MILLION OBAMA - 4 MILLION TRUMP - 1.2 MILLION BUT IT'S JUST A PROBLEM WHEN HE DOES IT
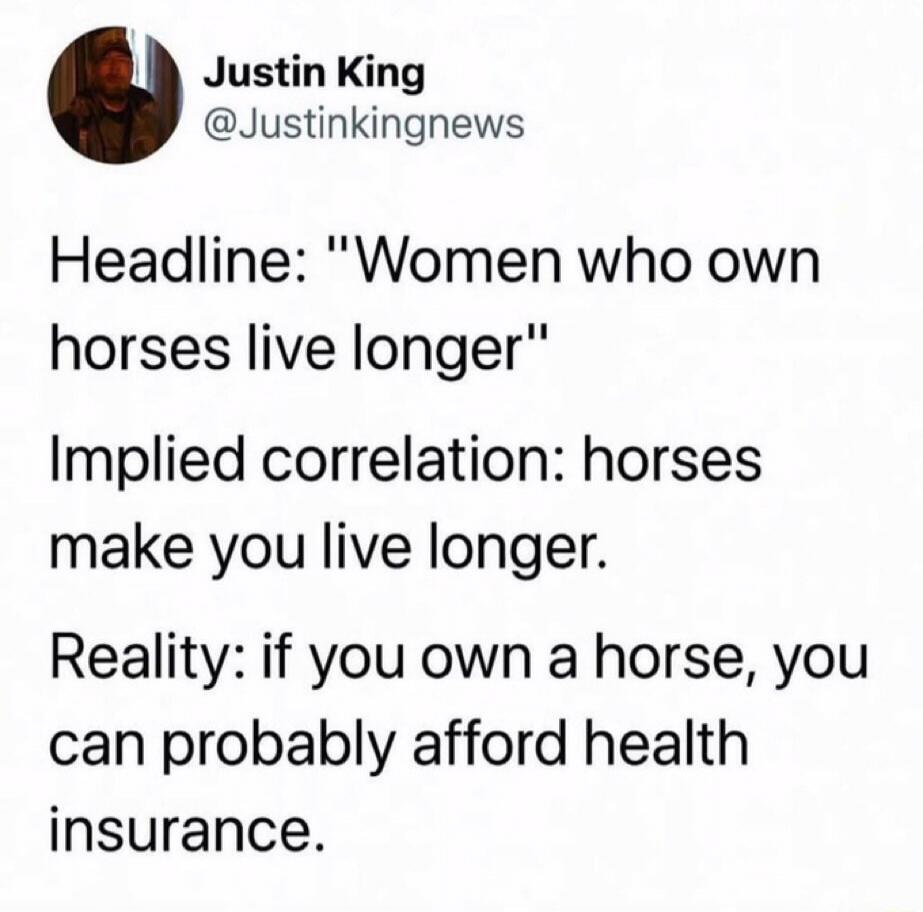
Justin King @Justinkingnews Headline: "Women who own horses live longer" Implied correlation: horses make you live longer. Reality: if you own a horse, you can probably afford health insurance.
Memes Today – is an entertainment platform built primarily on Android and iOS mobile apps. In order to use the full functionality of Memes Today, we ask you to download the mobile application available from the links below. By downloading the App, you can like, comment, save posts to favorites, share the content.